





Some of the best trading strategies are surprisingly simple. You define an important price range, wait for confirmation, and then use historical probabilities to determine which side of the market you want to trade.
This EURUSD breakout strategy does exactly that during the New York session.
The setup uses the overnight range from 7 PM to 4 AM New York time, then waits for the first confirmed 15-minute close outside that range.
What makes the strategy interesting is what has historically happened after that breakout.
According to historical data fromEdgeful, EURUSD has finished the trading day in the same direction as the initial breakout roughly 78% to 81% of the time, depending on the direction of the move. USDJPY has produced even stronger historical probabilities, reaching as high as 89%.
The idea isn't necessarily to chase the breakout candle. Instead, we use the breakout to establish a directional bias for the New York trading session.
EURUSD Breakout Strategy Step 1: Draw the Overnight Range
Forex trades 24 hours a day, but market behavior can change significantly as Asia, Europe and New York move through their respective sessions.
For this strategy, we're interested in what happens when price escapes the range established before the New York session gets going.
Start with a 15-minute chart.
Mark the highest and lowest price traded between 7 PM and 4 AM New York time.
Those two prices create the overnight range.
Once 4 AM arrives, the range is locked. We are no longer adjusting the high or low. From that point forward, we're watching to see which side price breaks.
But simply trading through one of those levels isn't enough.
We want confirmation.
Step 2: Wait for a 15-Minute Close
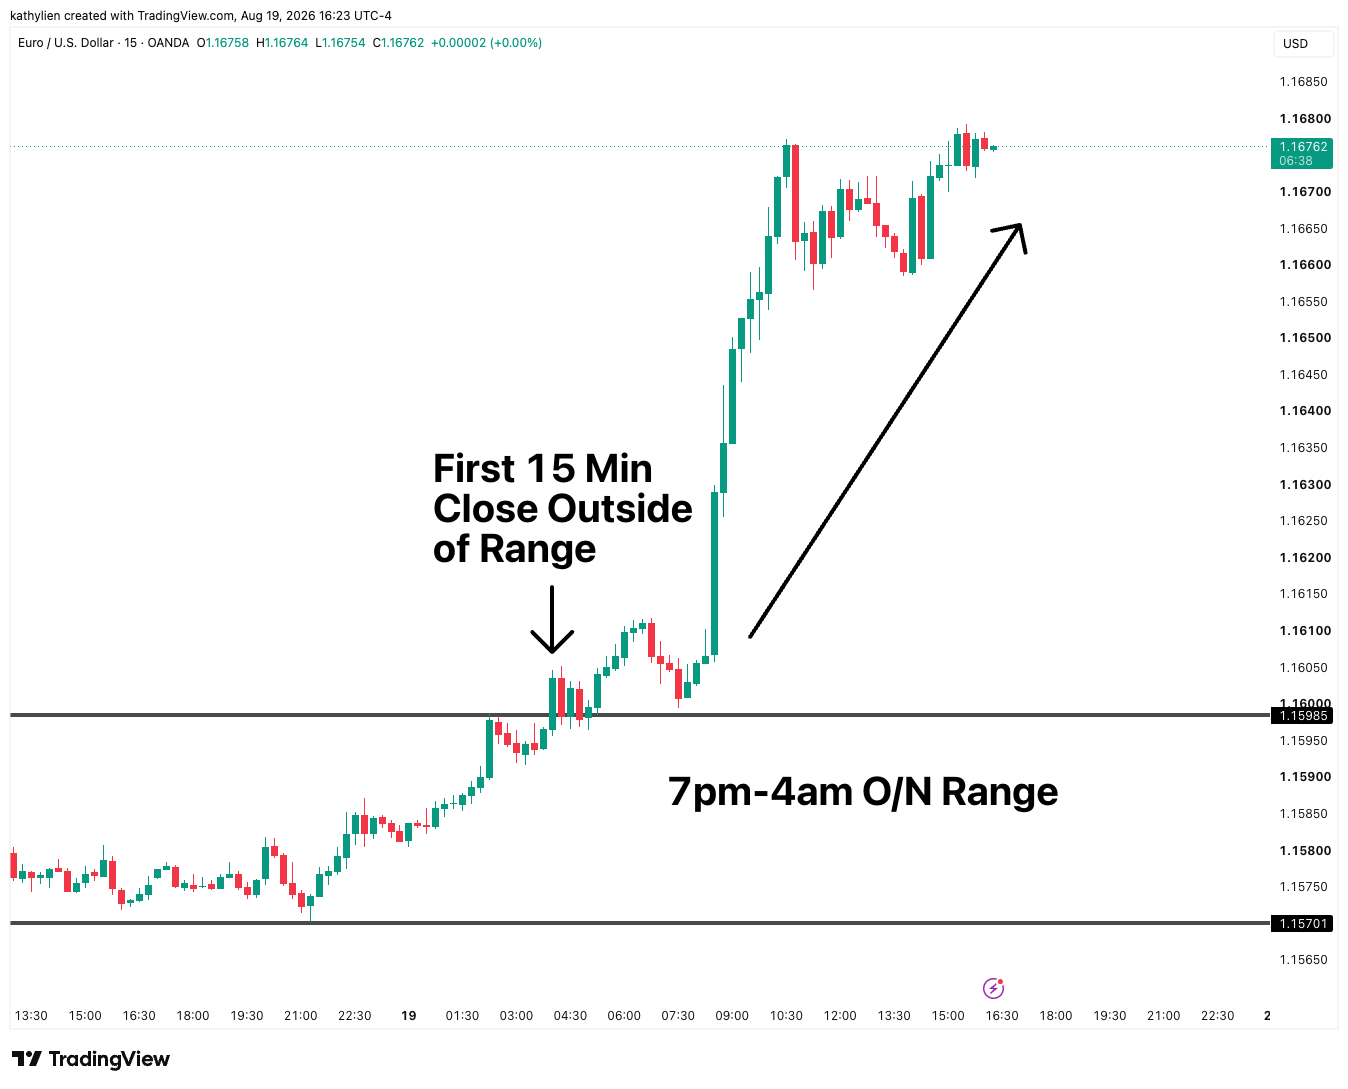
The trigger is the first 15-minute candle that closes outside the overnight range.
The word "close" is important.
Forex can easily poke above an overnight high or below an overnight low before immediately reversing. Those moves can trap traders who enter the moment the level is touched.
For this strategy, we want more evidence.
If a 15-minute candle closes above the overnight high, our directional bias becomes bullish.
If a 15-minute candle closes below the overnight low, our bias becomes bearish.
This is where the Edgeful statistics become particularly interesting.
EURUSD: 78% to 81% According toEdgeful
In the historical Edgeful study used for this setup, when the first confirmed 15-minute breakout was above the overnight range, EURUSD went on to finish the trading day higher approximately 78% of the time.
When the first confirmed breakout was below the overnight range, EURUSD finished the day lower approximately 81% of the time.
The tendency also remained relatively persistent over longer historical samples, with the probabilities declining only modestly toward the upper-70% area.
That's potentially useful information for a trader because we're not asking the breakout to predict exactly how far EURUSD will move.
We're using it to answer a simpler question:
Should I primarily be looking for longs or shorts?
USDJPY: An Even Stronger Historical Tendency
Edgeful's historical data showed the same pattern in USDJPY, but with even stronger numbers.
In the one-year sample used for this study, when the first confirmed 15-minute breakout closed below the overnight range, USDJPY finished the trading day lower approximately 84% of the time.
When the breakout was bullish, the historical probability increased to approximately 89% that USDJPY would finish the day higher.
Again, this does not mean that every bullish USDJPY breakout has an 89% chance of producing a profitable trade.
The Edgeful statistics measure what happened to the direction of the day after the breakout condition occurred. Your actual trading results will still depend on entry, stop placement, profit targets and risk management.
But the data can give traders a useful directional framework.
Don't Chase the Breakout
One mistake traders make with breakout strategies is assuming they have to enter immediately.
You don't.
If EURUSD closes decisively above its overnight range and has already moved sharply higher, buying the breakout candle itself could leave you entering at a poor price.
Instead, let the breakout establish your bias.
After a bullish breakout, look for opportunities to buy a retracement. That could be a move back toward the overnight high, a short-term support area or a moving average such as the 21 EMA.
After a bearish breakout, apply the same logic in reverse.
TheEdgeful statistics give you the directional bias. Price action gives you the entry.
Watch the Economic Calendar
There is one major exception: high-impact economic data.
CPI, Nonfarm Payrolls, Federal Reserve decisions and other major reports can completely reverse an earlier breakout.
EURUSD could break above its overnight range at 7 AM, for example, only to reverse violently following an 8:30 AM economic release.
That's why checking the economic calendar should always be part of the process.
If a major release is approaching, it may make more sense to wait until after the data before relying on the breakout.
A Simple Data-Backed Framework
No historical statistic guarantees the next trade will work.
But the Edgeful data makes this setup worth watching.
Define the 7 PM to 4 AM overnight range. Wait for the first confirmed 15-minute close outside it. Use the direction of that breakout to establish your bias. Then wait for price to provide an attractive entry in the same direction.
For EURUSD in particular, the historical 78% to 81% directional tendency measured byEdgeful suggests that the first confirmed breakout of the overnight range can provide traders with a valuable clue about how the rest of the day may unfold.
Source: Edgeful historical market data. Historical probabilities are based on past market behavior and do not guarantee future results.