




The Federal Reserve hiked interest rates for the first time since 2023 on Wednesday, raising the federal funds target range by 25 basis points to 3.75% to 4.00%.
But for traders, the important question is no longer whether the Fed would hike.
It’s what happens next.
The Fed made it clear that Wednesday’s move may not be a one-and-done increase. Policymakers said inflation remains elevated and that the hike was intended to bring inflation back toward 2% more quickly.
The new economic projections reinforced that message with higher growth and inflation forecast. Most importantly, the median projection for the federal funds rate rose to 4.1% at the end of 2026, implying one more rate hike this year.
The first reaction was textbook
Markets initially responded exactly the way you would expect to a hawkish Fed.
The U.S. dollar strengthened. Gold fell. Stocks came under pressure. And the 10-year Treasury yield pushed back toward 5%.
But the first move after an FOMC decision is not necessarily the important one.
The bigger question is whether Wednesday marked the beginning of another sustained rise in interest rates.
Because if it did, the most important chart for traders may not be the S&P 500, Nasdaq or gold.
It may be the 10-year Treasury yield.
Could the 10-year yield be heading toward 6%?
The 10-year yield is already around the psychologically important 5% level.
That sounds high.
History suggests it could potentially go higher.
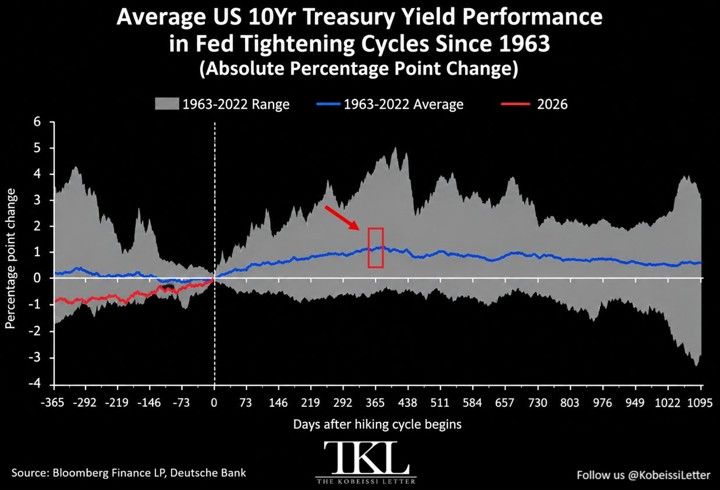
According to The Kobeissi Letter, across Fed tightening cycles going back to 1963, the 10-year Treasury yield has risen by roughly 50 basis points on average during the first six months after the Fed begins raising rates.
Twelve months after the first hike, the average increase has been around 110 basis points.
If history followed that average path from a starting point near 5%, the 10-year yield could theoretically move above 6% sometime next year.
That would be the highest level since 2000.
But the range of historical outcomes is enormous.
In some tightening cycles, 10-year yields rose as much as 400 basis points. In others, they actually declined by roughly 70 basis points.
So the takeaway isn't that the 10-year will reach 6%.
It's that 5% does not automatically represent the top simply because it looks high.
For traders, that makes the direction of yields from here extremely important.
The stock market trade is more complicated
A Fed hiking cycle sounds bearish for stocks.
History says it's not quite that simple. LPL Research looked at the six Fed tightening cycles since 1994 and found that stocks tended to struggle initially. On average, S&P 500 returns were negative during the first four months following the first rate hike.
But the picture improved significantly five to six months later. Twelve months after the first hike, the S&P 500 produced an average gain of 6.7% and a median gain of 10.7%.
There were two important extremes.
In 2022, the first Fed hike was followed by a major equity selloff as inflation surged and the Fed was forced into an extremely aggressive tightening cycle.
In 1997, the opposite happened. The S&P 500 gained roughly 42% during the 12 months following the first hike as the technology boom overwhelmed the impact of tighter monetary policy. That comparison is particularly interesting today because AI investment continues to support economic growth and corporate spending.
So simply saying:
Fed hikes = sell stocks
may be too simplistic.
The better question is whether higher rates eventually become restrictive enough to slow growth or undermine the investment boom that has helped support equities.
Watch 5% on the 10-year Treasury yield
This is why the 10-year Treasury yield may become the market's most important line in the sand.
If the 10-year decisively breaks above 5% and continues higher, financial conditions tighten even without another Fed meeting. Mortgage rates rise. Corporate borrowing becomes more expensive. Bonds become more competitive with stocks.
And high-valuation growth companies have to compete against increasingly attractive risk-free yields. That would create a more difficult environment for equities, particularly rate-sensitive technology stocks.
But if the 10-year repeatedly fails above 5% and yields begin falling despite the Fed hike, the message from markets would be very different. It could mean investors believe the Fed has already tightened enough or that higher rates will eventually slow the economy and inflation. That scenario could provide relief for both stocks and gold.
Gold and the dollar may be simpler trades
For gold and the U.S. dollar, Treasury yields give traders a relatively clean framework.
If yields continue rising and markets price additional Fed hikes:
Dollar: Bullish bias
Gold: Bearish bias
Higher U.S. yields make dollar-denominated assets more attractive and increase the opportunity cost of holding non-yielding gold. That was exactly what happened immediately after Wednesday's decision: the dollar strengthened while gold declined.
But the opposite is also true.
If yields peak despite additional hawkish Fed rhetoric, the dollar could lose momentum and gold could recover quickly.
For gold traders in particular, the critical question may be:
Can gold hold up while the 10-year is above 5%?
If it can, that would be an important sign of underlying strength.
Don't ignore the Treasury
There is another wildcard.
The U.S. Treasury has already increased its bond buybacks as officials try to improve liquidity in the Treasury market.
A recent long-dated buyback was increased to as much as $6 billion, triple the size of the previous operation. Yet yields continued rising afterward, suggesting that the bond market is currently being driven by forces much larger than Treasury buybacks alone.
If long-term yields continue climbing sharply, traders should expect the debate around additional Treasury actions to intensify.
But buybacks are not the same thing as the Federal Reserve stepping in to suppress yields. Reuters reported that direct Fed intervention in the Treasury market is currently viewed as unlikely.
That distinction matters.
So what's the trade?
There are really three scenarios traders should be watching.
Scenario 1: The 10-year breaksfirmlyabove 5% and keeps rising.
This would reinforce the Fed's hawkish message.
The dollar would likely remain supported, gold could face additional pressure, and stocks particularly expensive growth stocks would become increasingly vulnerable.
Scenario 2: The 10-year fails at 5%.
This may be the more interesting reversal trade.
Falling yields following a Fed hike would suggest that markets believe much of the tightening is already priced in. That could weaken the dollar while providing support for gold and equities.
Scenario 3: Yields rise, but stocks refuse to fall.
Don't dismiss this scenario.
That is essentially what happened during parts of the late-1990s tightening cycle.
Strong growth and enthusiasm around transformative technology allowed stocks to continue climbing despite higher rates.
If AI spending, earnings and economic growth remain strong enough, equities could potentially absorb higher yields for longer than many traders expect.
But there will eventually be a level where the bond market becomes too attractive, or or borrowing costs become too restrictive for stocks to ignore.
Finding that level may be one of the biggest trades of the next several months.