





There are many ways to trade the markets, but one of our favorites is using moving averages. They are simple, easy to understand and incredibly useful for identifying trend and momentum. They can help traders see whether a market is strengthening, weakening or potentially changing direction.
One of the most popular ways to use them is through a moving average crossover strategy. The idea is straightforward. When a shorter-term moving average crosses above a longer-term moving average, it can signal that momentum is turning higher. When the shorter-term average crosses below the longer-term moving average, it can suggest momentum is shifting lower.
The most famous example is the Golden Cross, when the 50-day moving average crosses above the 200-day moving average. But with so many possible moving average combinations, we wanted to know which crossover actually works best.
The Research Behind the Strategy
That question led us to research from ETF HQ. They tested a large number of moving average combinations using roughly 300 years of daily and weekly data across 16 global stock market indices.
They also compared different types of moving averages and found that exponential moving averages, or EMAs, generally performed better than simple moving averages. That makes sense because EMAs put more weight on recent prices, making them more responsive when momentum begins to shift.
But the most interesting finding was the combination that produced some of the strongest results: the 13-day EMA and 48.5-day EMA.
That caught our attention, so instead of simply taking the research at face value, we decided to test it ourselves on Nasdaq which is a momentum-driven market. When larger trends develop, they can move quickly and persist for days or weeks, which is exactly the type of environment where daily moving averages can be useful.
There was just one small adjustment. TradingView does not allow us to enter a 48.5-period EMA, so we rounded it to the nearest whole number and used the 49 EMA. That means our test is not an exact replication of ETF HQ's 13/48.5 EMA combination. It is the closest practical version we could test and trade directly on TradingView: the 13 EMA and 49 EMA.
This Is a Swing Trading Strategy
Before getting into the results, there is one very important point: this strategy is designed for swing trading using the daily chart.
The goal is to capture a larger change in Nasdaq momentum rather than trade normal intraday noise. If you are trading NQ or MNQ intraday, this is not the setup we would use for entries and exits. For this strategy, we are looking specifically at daily closes and daily EMA crossovers.
Nasdaq Moving Average Crossover: We Tested the 13 EMA / 49 EMA
The setup itself is simple. A bullish signal occurs when the 13 EMA crosses above the 49 EMA on the daily chart, while a bearish signal occurs when the 13 EMA crosses below the 49 EMA on the daily chart.
But an entry signal is only one part of any strategy. The next question is just as important: where do you exit?
Rather than waiting for the next crossover, we tested the strategy using a fixed stop and profit target. That is where the results became especially interesting.
The Best Results Came From a 1:1 Setup
We tested the crossover using a 1.5% stop loss and a 1.5% profit target, giving the strategy a simple 1:1 risk-to-reward ratio.
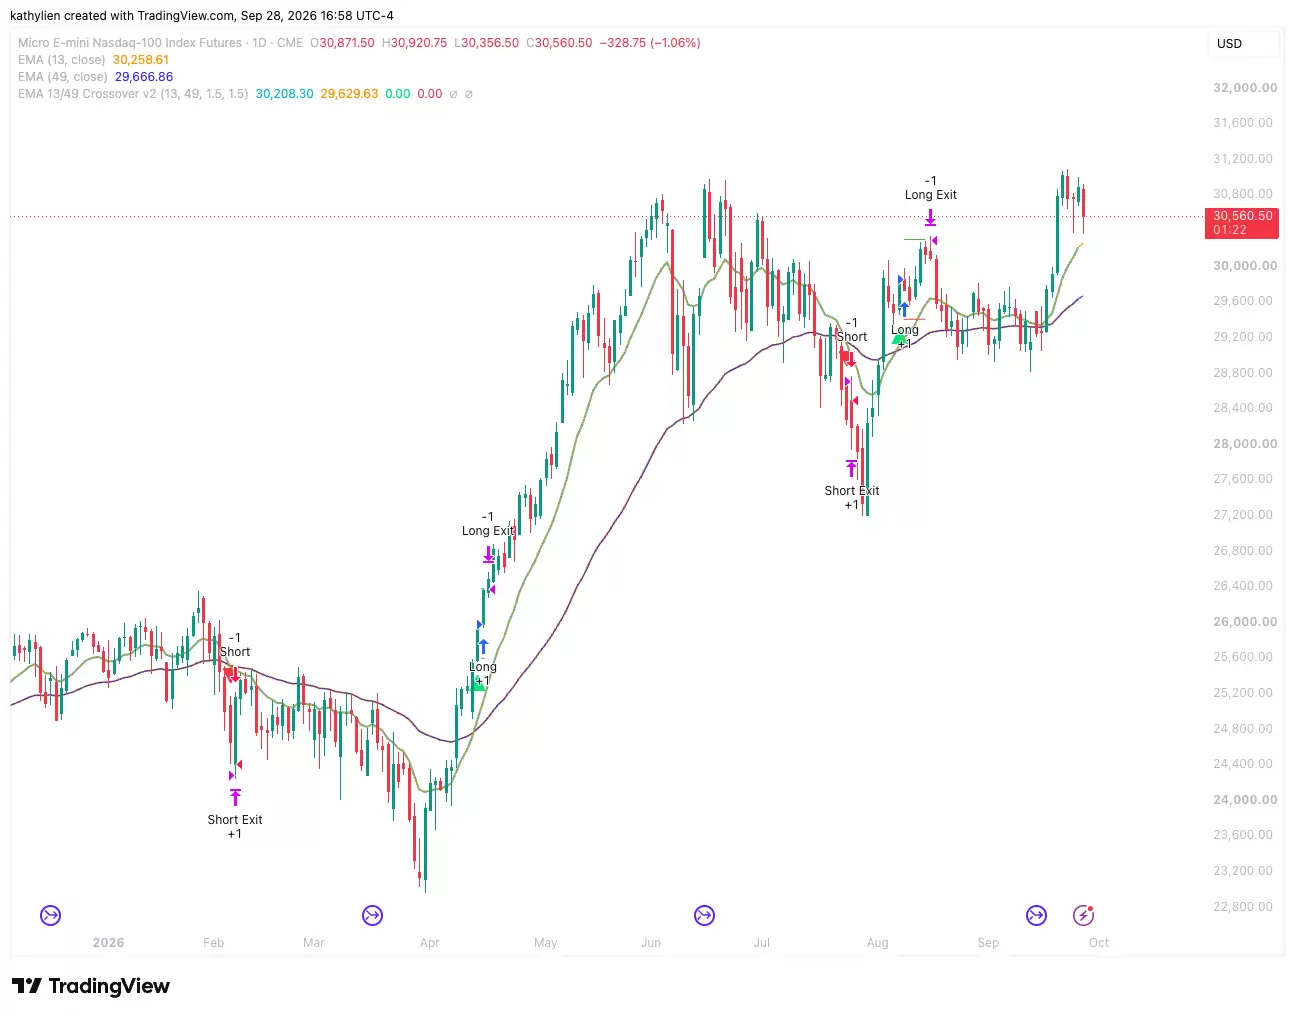
From September 28,2024 through September 28, 2026, the daily-chart strategy generated six crossover trades. Five of the six were winners, producing 83.33% accuracy and a 6.96 profit factor.

For such a simple swing trading setup, that is a very strong recent result. Of course, six trades is still a small sample size, so the 83.33% win rate should not be treated as something that will automatically continue going forward. That is why we also looked further back.
What Happened Over Four Years?
When we expanded the test to four years, the win rate dropped to approximately 65%, but it maintained a 1.929 profit factor.
That is lower than the two-year result, but it is also a useful reminder that strategy performance changes as market conditions change. Markets trend differently, volatility changes and momentum changes. No strategy performs exactly the same way forever.
Still, a roughly 65% historical win rate with a 1.929 profit factor and a 1:1 risk-reward profile is notable, especially for a system based on just two moving averages and a fixed exit framework.
Why Not Target 3% or 4%?
This was one of the most interesting parts of the test. If a 1.5% profit target works well, it would seem logical to aim for more. Why not 3% or 4%?
The problem is that when we increased the profit target, the accuracy dropped significantly. That tells us something important about this crossover. The daily signal may do a good job of identifying a change in momentum, but that does not mean every crossover immediately develops into a huge trend.
A 1.5% target asks Nasdaq for a relatively modest continuation after the signal. A 3% or 4% target asks for much more, giving the market more opportunity to retrace, consolidate or reverse before the target is reached. We invite you to add the moving averages to your Nasdaq chart and review the performance yourself.
Ready to trade Nasdaq? Check out our prop firm discount links and current offers here: View current prop firm offers
Backtested results are hypothetical and do not guarantee future performance. Performance can vary depending on instrument, execution, commissions, slippage, data source and methodology. The recent two-year test also contains a limited number of trades and should not be considered statistically conclusive.