




Volume is one of the most useful tools in trading, but it is also one of the most misunderstood. Most traders see a big volume spike and assume a big move is coming. Some immediately buy, thinking the surge in activity means prices are headed higher. Others assume the market is exhausted and start looking for a reversal. The problem is that volume alone does not tell you which direction to trade.
That is the first rule of how to trade volume: watch where it appears, how price reacts, and whether the move gets follow-through.
A volume spike at resistance means something very different from a spike during a breakout. Heavy trading at support can signal aggressive selling, but if price refuses to move lower, it may actually be telling you that buyers or sellers are getting absorbed and control is shifting.
For Nasdaq and S&P futures, there are three volume setups that I think every intraday trader should learn to recognize.
How to Trade Volume Across Three Timeframes
Rather than watching volume on a single chart, I prefer using three timeframes, each with a different purpose.
The 15-minute chart gives market context. This is where I identify the trend, major support and resistance, prior highs and lows, and whether the market is trending or consolidating.
The 5-minute chart is where I look for the actual setup. This is where volume becomes actionable. I want to see whether price is breaking a key level, rejecting support, stalling at resistance, or showing signs of exhaustion.
The 1-minute chart is for entry. Once the setup is confirmed on the 5-minute chart, the 1-minute helps with determining timing, risk, and execution.
This is a great example of how the three-timeframe framework works in practice: 15-minute context, 5-minute setup, 1-minute execution.
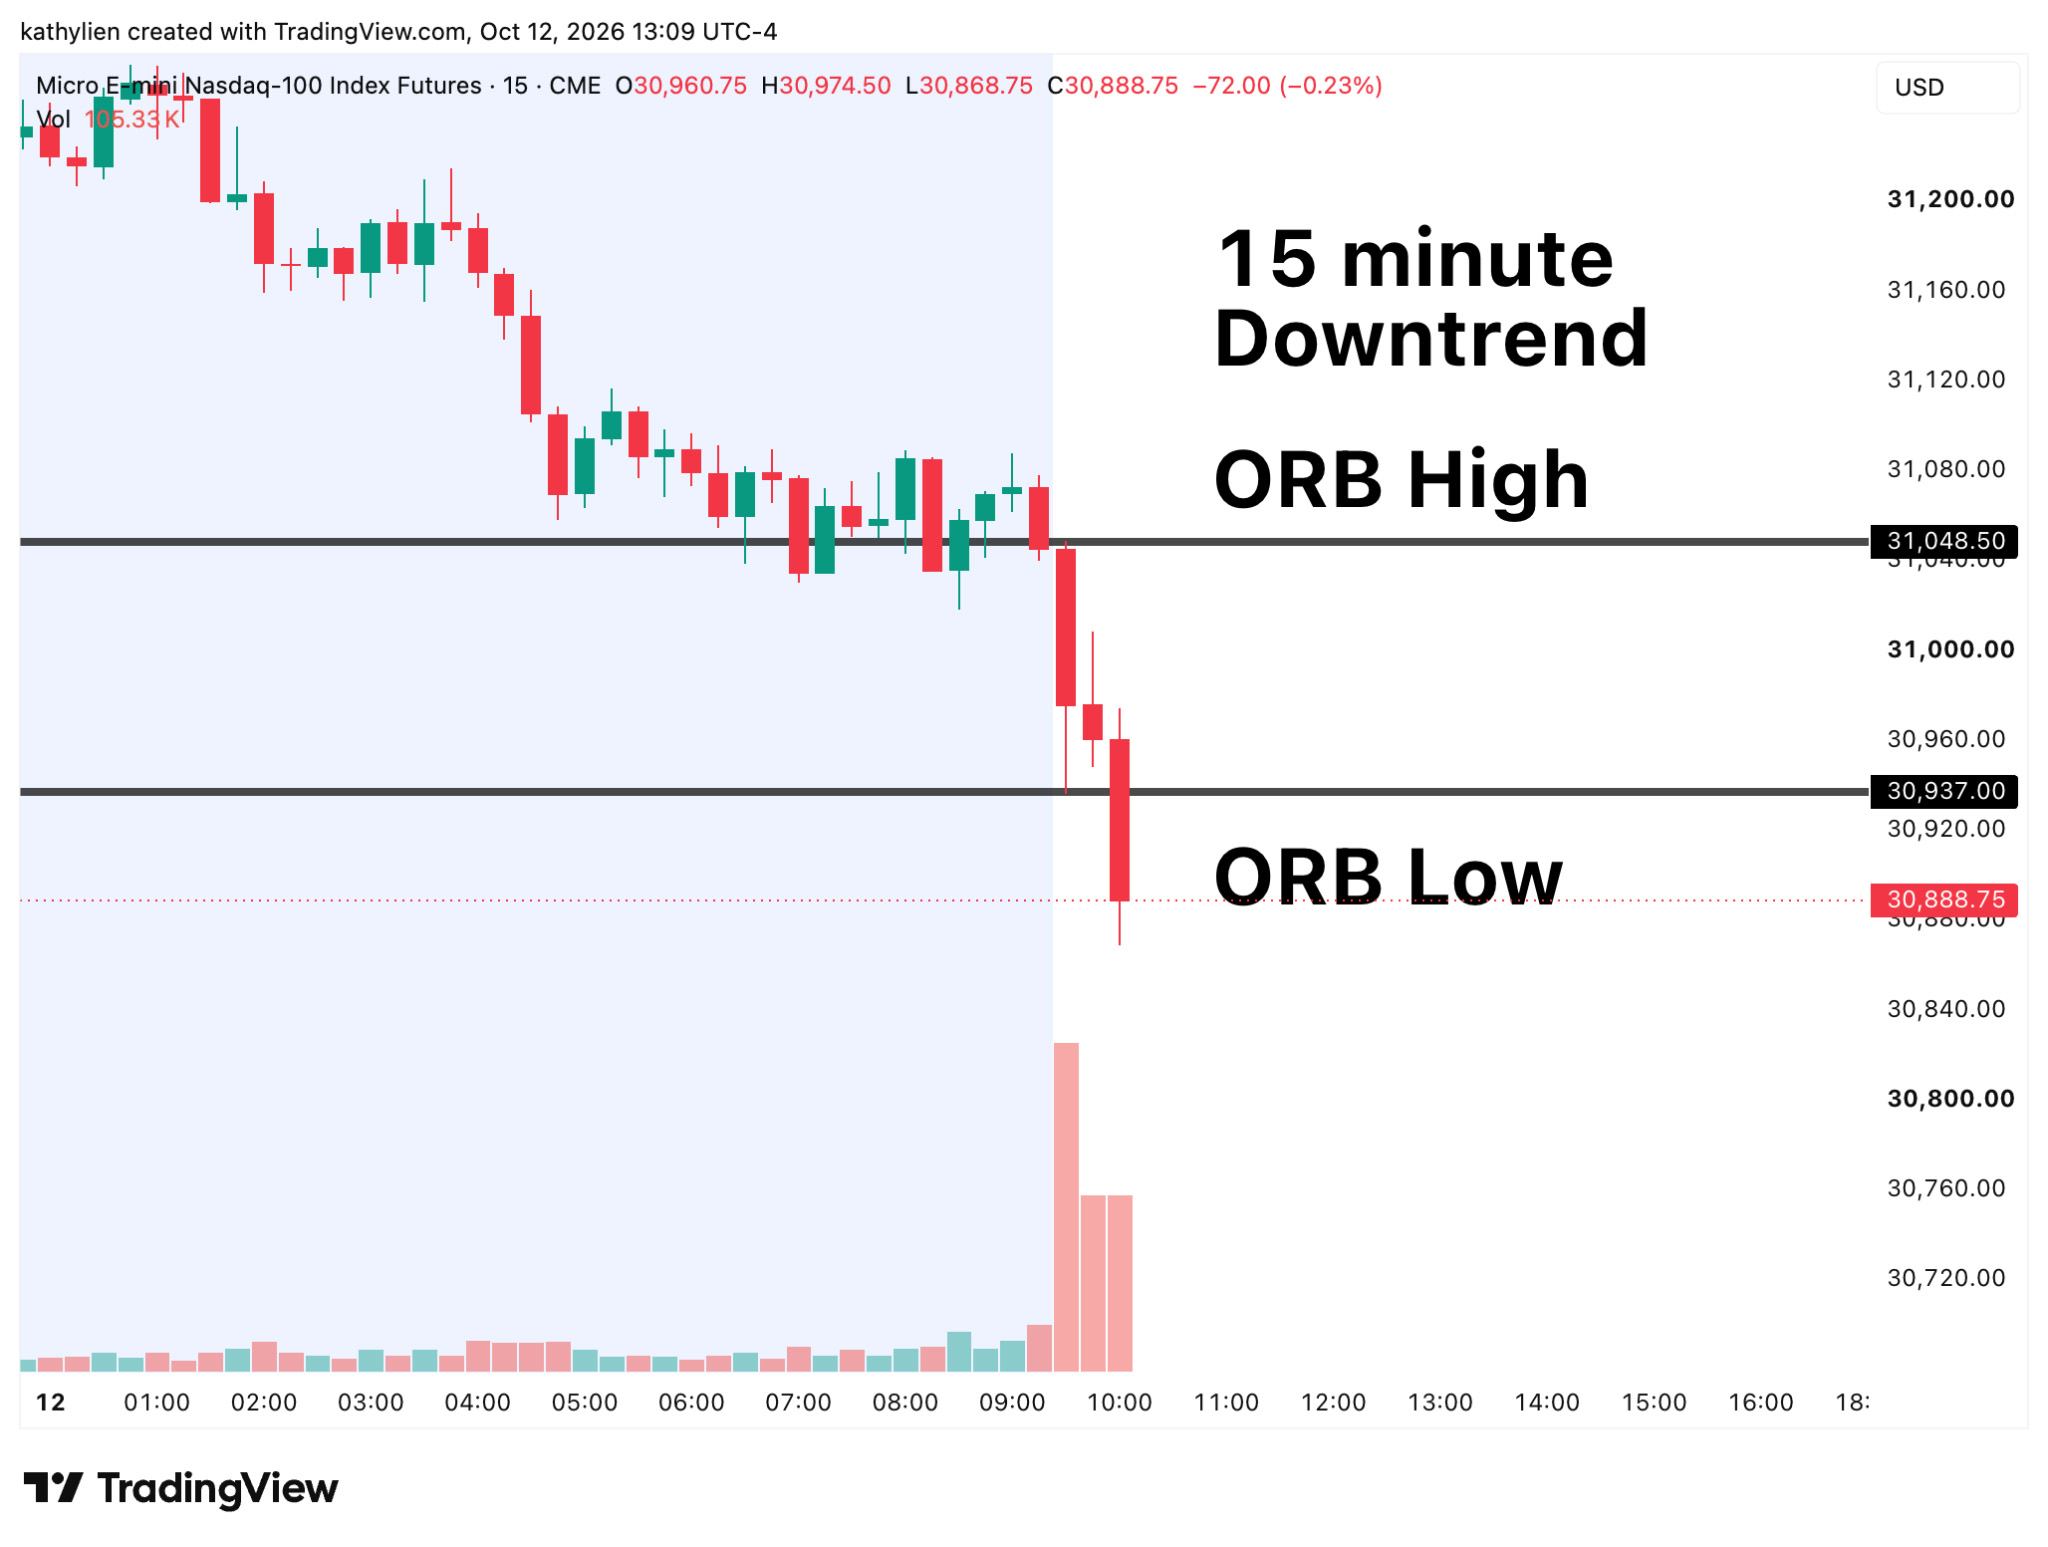
On the 15-minute example, MNQ is already in a downtrend. Price is trading below the ORB high and pressing toward the ORB low. That tells us the broader context is bearish and that a break of the ORB low is more likely to be a continuation move than a random breakdown.
15-Minute Chart Example
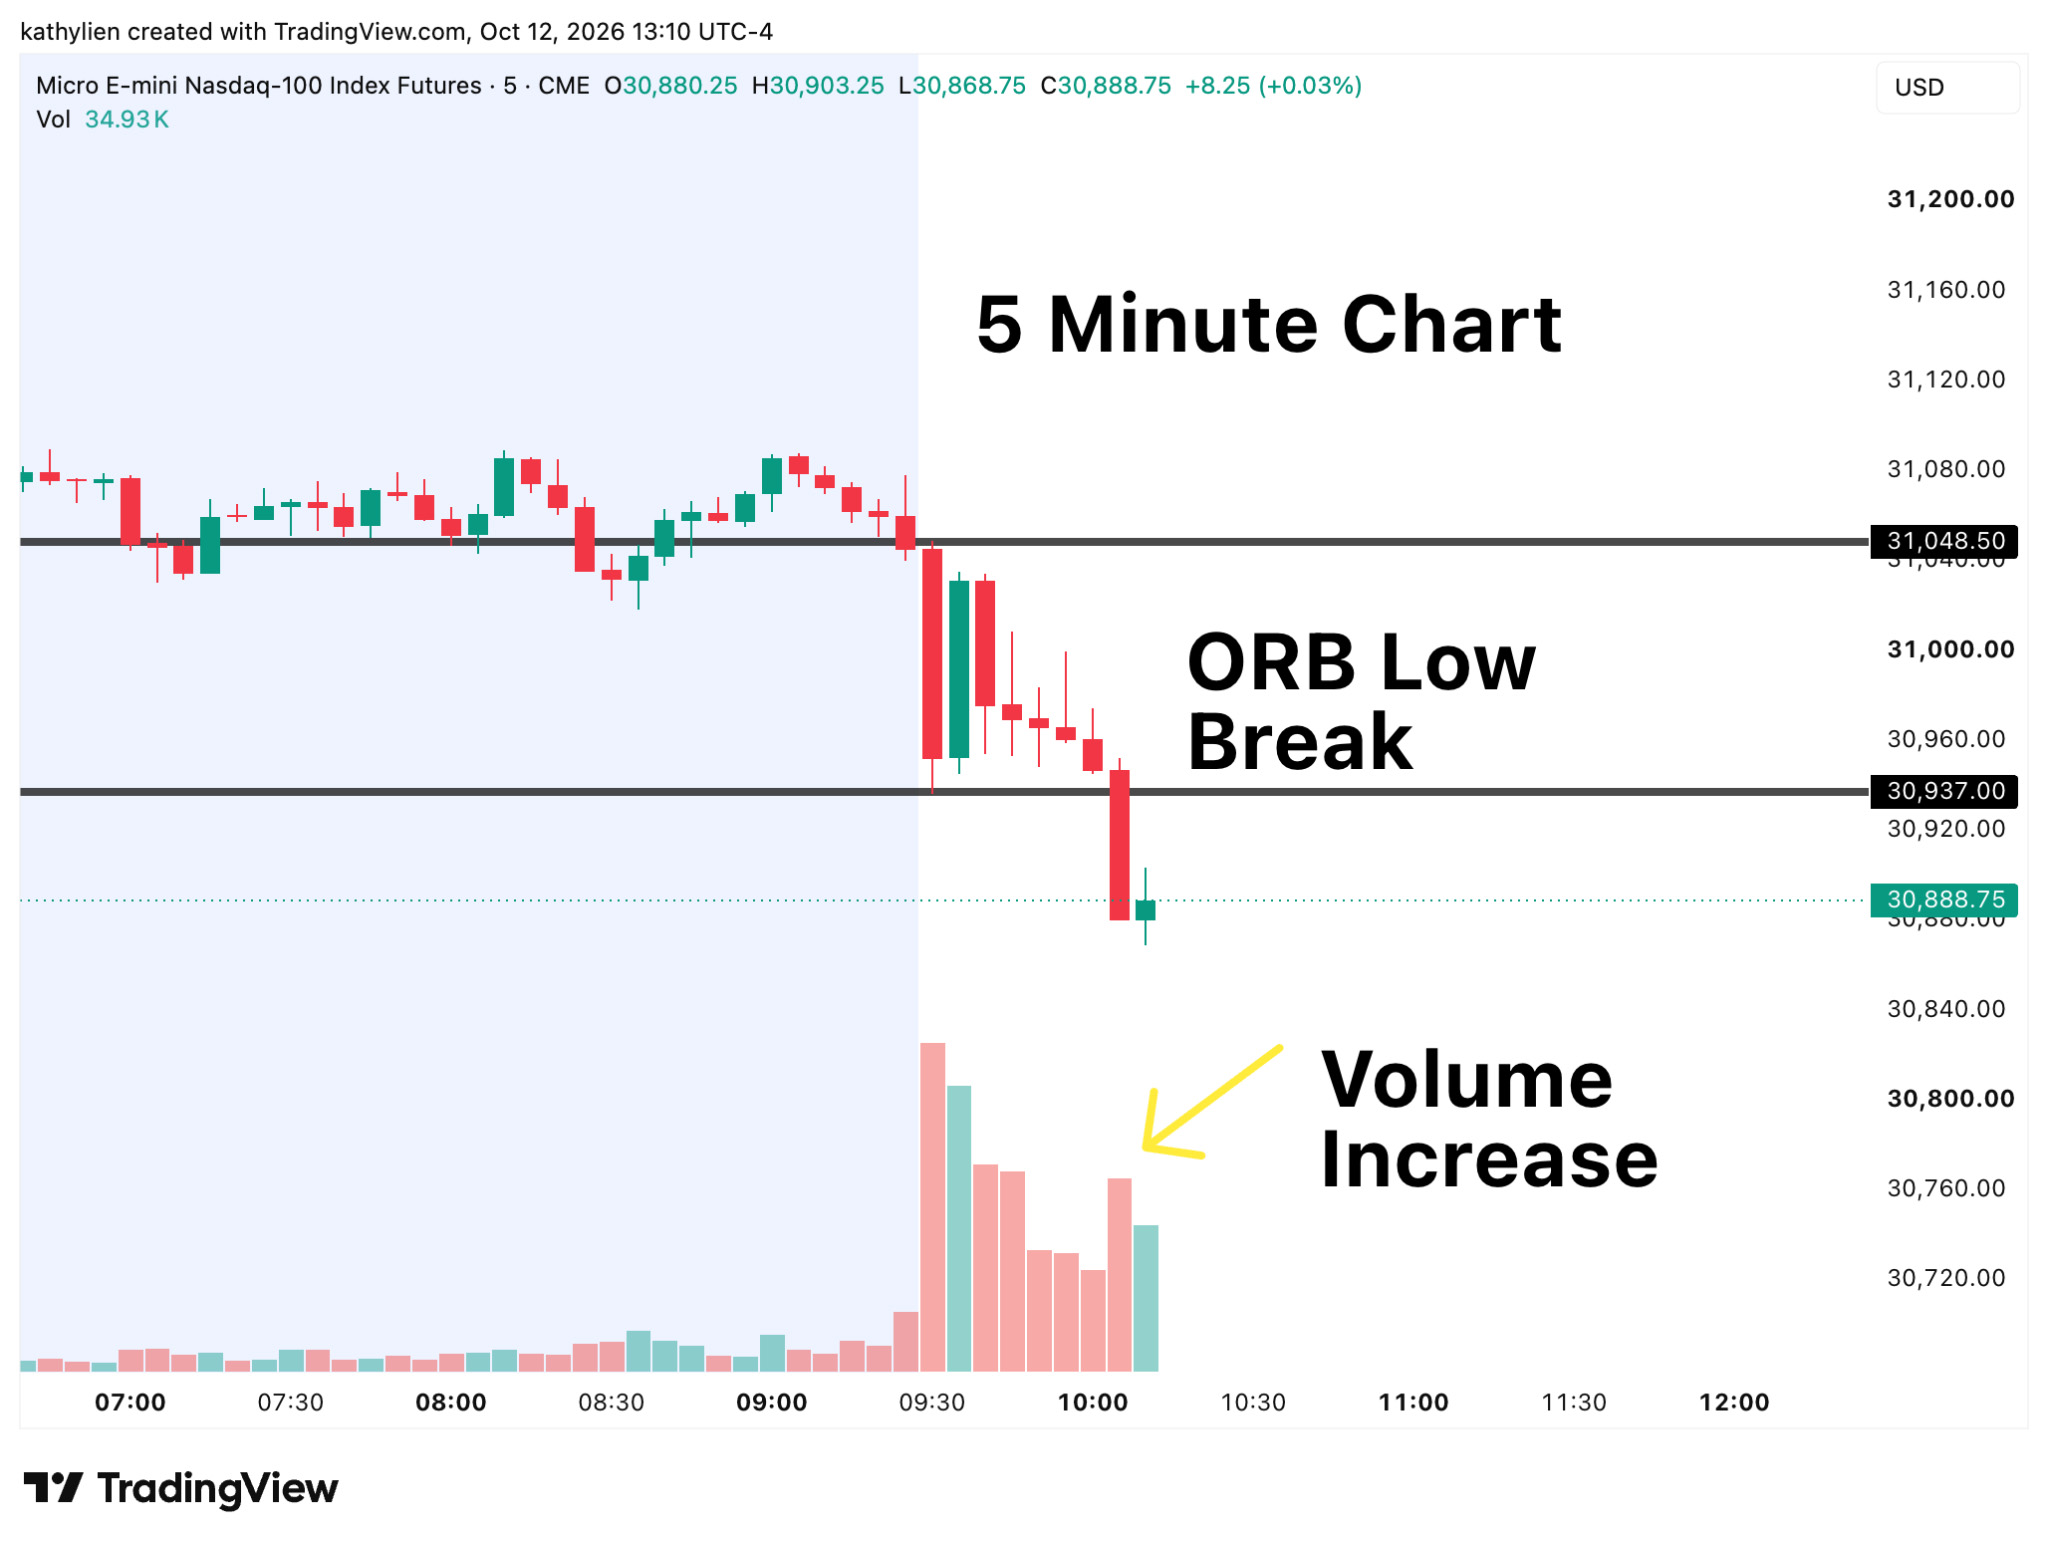
On the 5-minute chart, price breaks below the ORB low and volume increases. That is the setup confirmation. The level matters, the direction matches the higher-timeframe trend, and the rise in volume tells us participation is expanding as price pushes through support.
5-Minute Chart Example
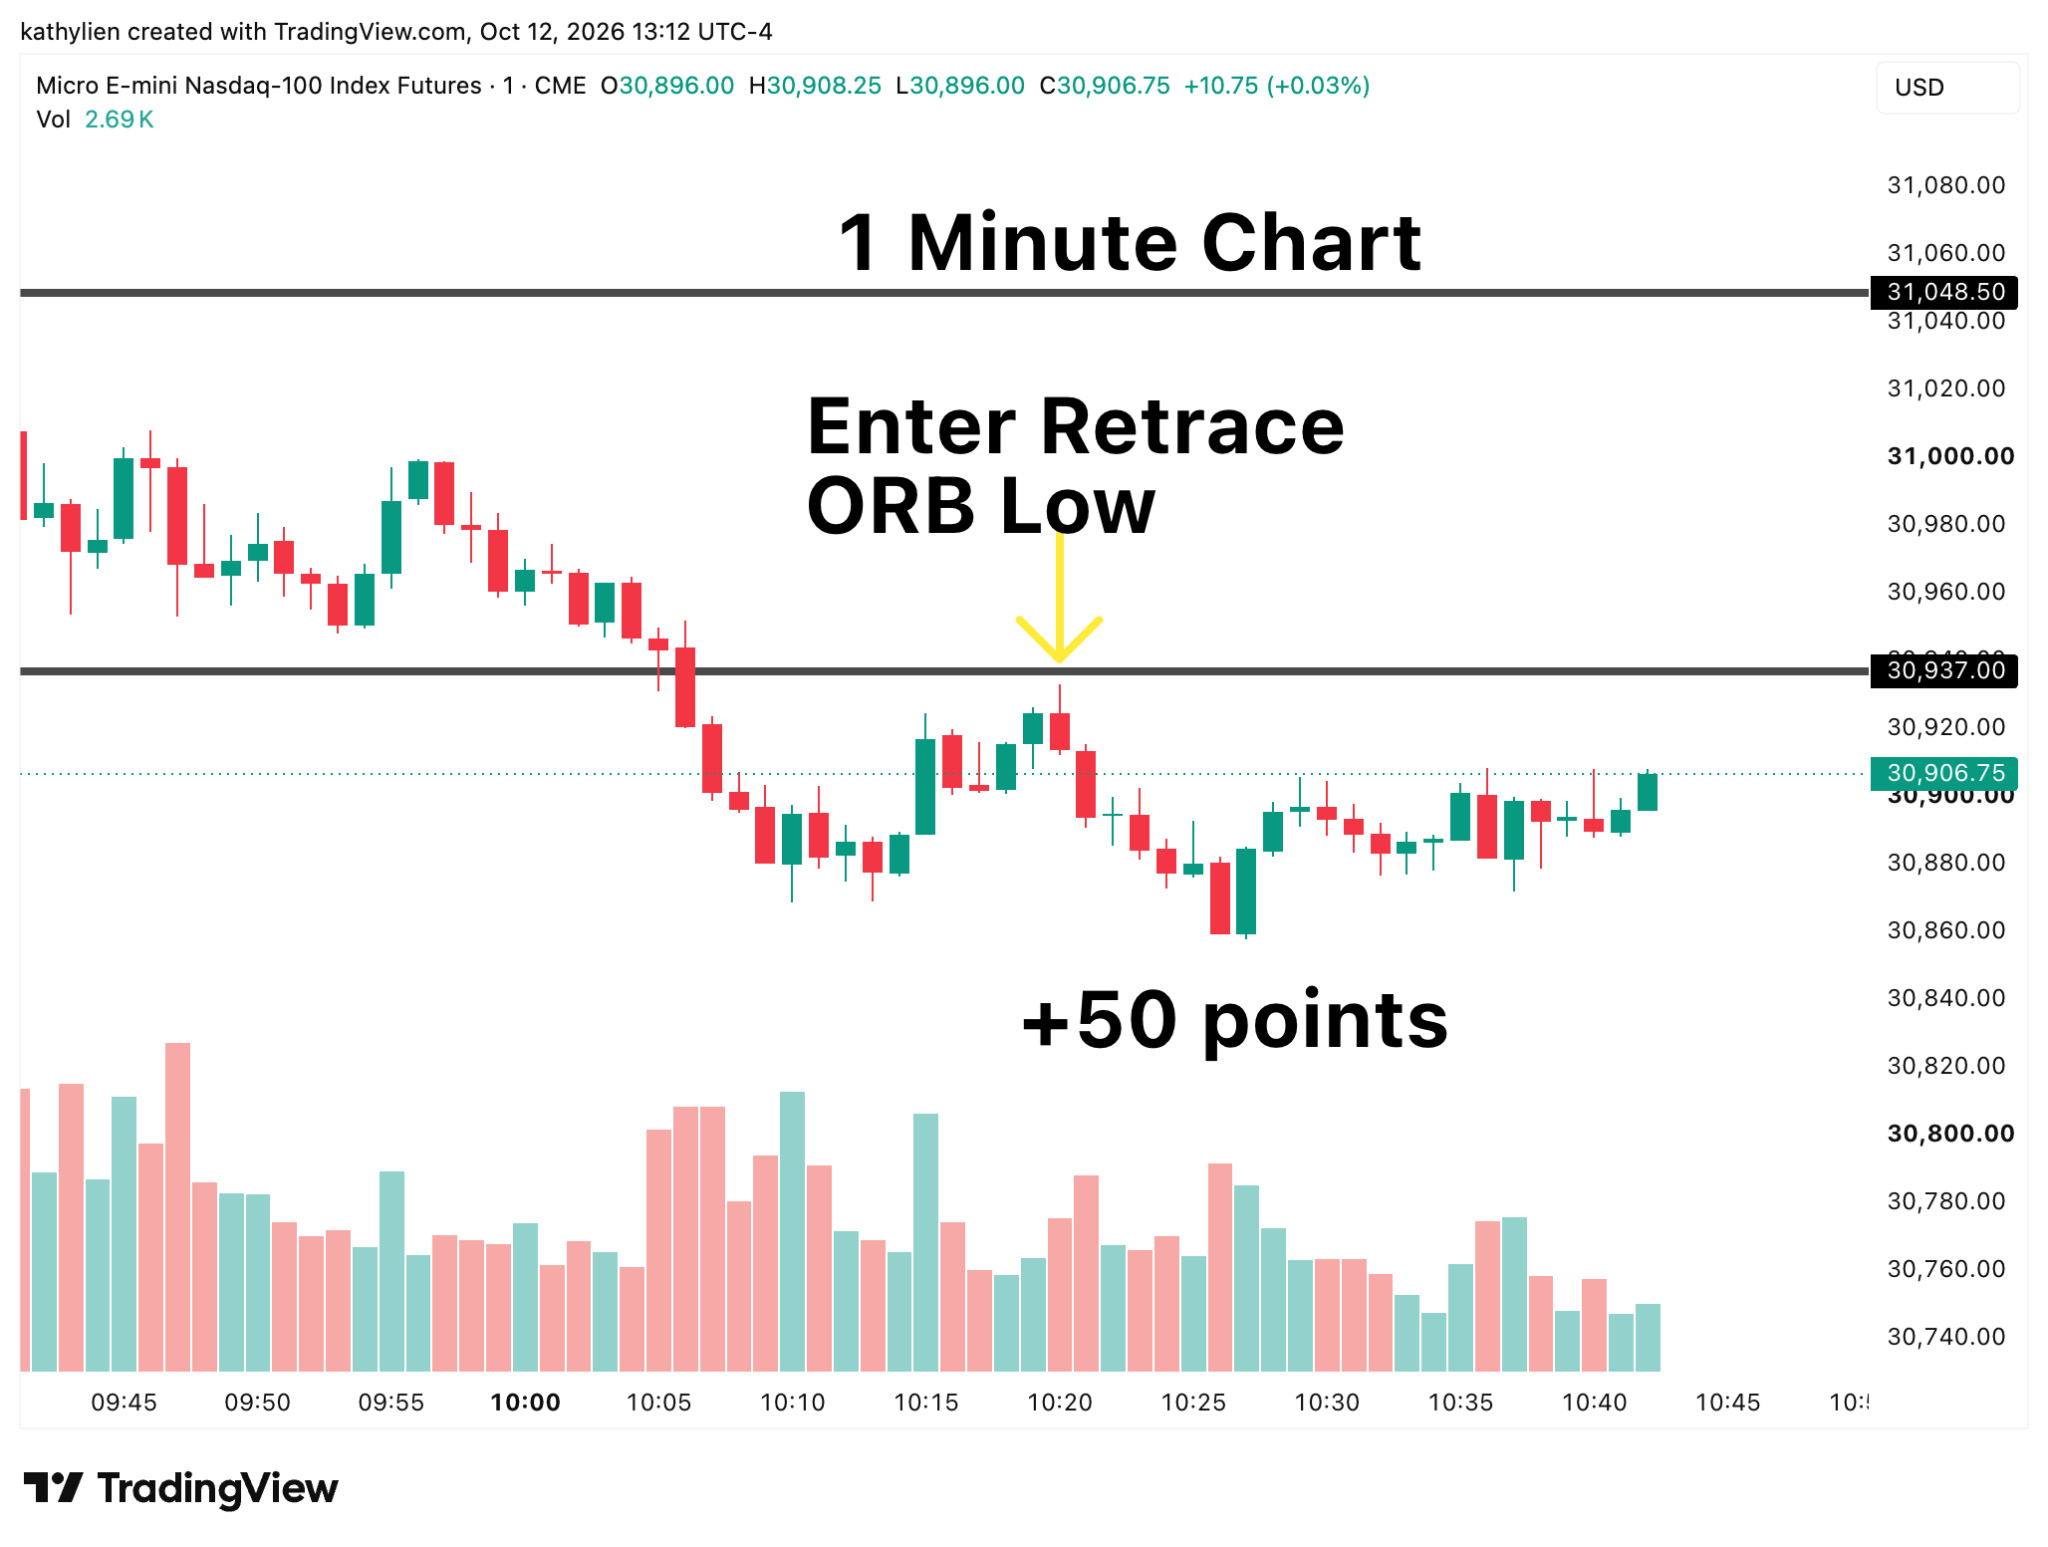
On the 1-minute chart, price retraces back toward the ORB low, retests the level from underneath, and fails. That retest provides the entry. In this example, the retrace short at the ORB low led to about a 50-point move lower.
1-Minute Chart Example
Setup 1: Breakout and Hold on High Volume
One of the strongest continuation signals occurs when price breaks an important level on elevated volume and then holds beyond it.
That is exactly what our ORB low example shows on the short side. The 15-minute chart establishes the bearish trend. The 5-minute chart shows the ORB low break with increased volume. The 1-minute chart then gives the trader a cleaner entry on the retrace back into the ORB low after support becomes resistance.
The same principle applies in bullish markets as well. If price breaks above resistance on strong volume and holds above it, the breakout becomes far more credible.
What to look for: a clear 15-minute level, a strong 5-minute break with elevated volume, and price holding beyond the level before using the 1-minute chart to enter.
Setup 2: High-Volume Support Rejection With a Long Wick
This is one of my favorite ways to use volume in an uptrend because it helps identify situations where sellers push prices lower but fail to maintain control.
Let’s say the S&P 500 has been trending higher throughout the morning. On the 15-minute chart, price pulls back toward a prior breakout level or an important support zone. Then on the 5-minute chart, a candle pushes below support but reverses sharply, leaving a long lower wick on high volume.
The wick shows that lower prices were rejected. The high volume tells us the rejection happened during heavy participation. That combination suggests buyers may be absorbing selling pressure.
I would not automatically buy the wick. I would wait for the next 5-minute candle to turn green and ideally close higher. The 1-minute chart can then help identify an entry after a small pullback or break above a short-term high.
Setup 3: Volume Spike at Support or Resistance With Price Rejection
A lot of traders assume that high volume is bullish, especially when prices have been rising. But heavy activity at resistance can sometimes warn of a reversal.
Imagine NQ rallies into the previous day’s high, a level identified on the 15-minute chart. As price reaches resistance, volume suddenly increases. You might expect that to produce a breakout, but instead price struggles to move higher.
On the 5-minute chart, the candle forms a long upper wick or closes back below resistance despite the increased volume. That tells us buying pressure was met by enough selling interest to prevent further progress.
The failure is what matters. High volume tells you there was significant participation, but the rejection tells you the market could not sustain higher prices. I would then look for bearish follow-through on the next 5-minute candle and use the 1-minute chart to refine the short entry on a failed retest or lower high.
The Takeaway
You do not need a complicated set of indicators to trade volume. What you need is a process.
Start with the 15-minute chart to identify the trend and the level. Use the 5-minute chart to identify the setup. Then drop to the 1-minute chart to refine the entry after confirmation.
Our ORB low example captures that process perfectly. The 15-minute chart showed a downtrend and key ORB levels. The 5-minute chart showed the ORB low break and increase in volume. The 1-minute chart showed the retrace entry back into the ORB low, which then led to a 50-point move.
That is how to trade volume. Volume tells you where the activity is. Price action tells you who may be gaining control. Follow-through tells you whether that control is holding.