





The September trading outlook 2026 starts with numbers that are difficult to ignore.
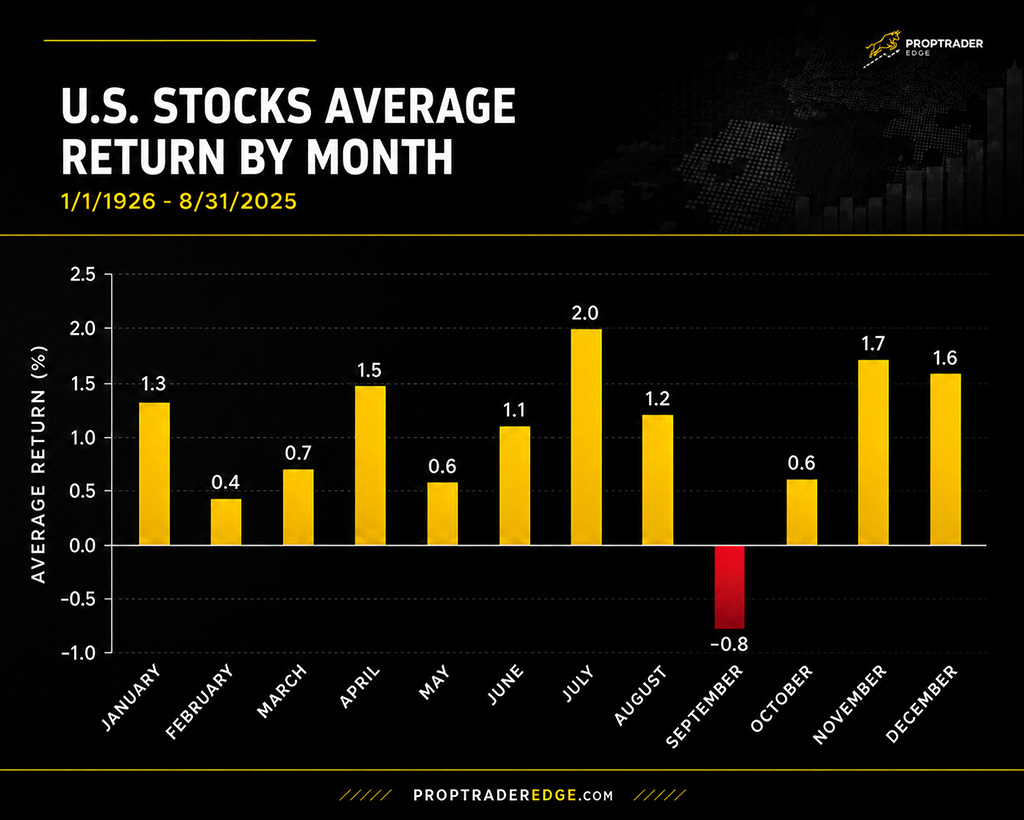
Using U.S. stock market data going back to 1926, September has produced an average return of approximately -0.8%, making it the only month of the year with a meaningfully negative long-term average in the data shown.
Compare that with:
That doesn't mean stocks have to fall this September. But when nearly a century of data identifies the same month as a historical trouble spot, it deserves attention.
More importantly, the September trading outlook 2026 has several reasons why that seasonal weakness could matter more than usual.
September Trading Outlook 2026: The Bond Market Warning
One of the biggest concerns right now is the Treasury market.
The U.S. Treasury has been attempting to support the long end of the bond market through purchases that initially helped push 30-year yields lower.
But that relief didn't last.
After Fed Chair Kevin Warsh's more hawkish comments, yields rebounded sharply. The 10-year Treasury yield has climbed back toward its highest levels since January, despite softer U.S. economic data and efforts to ease pressure further out on the yield curve.
That's an important signal.
The Treasury clearly has an incentive to keep borrowing costs under control, but the Federal Reserve has a different problem: inflation.
If yields continue rising, that creates a headwind for equities. Higher yields increase borrowing costs for consumers and businesses while also making bonds more competitive with stocks.
For growth-heavy indices like the Nasdaq, that can be especially important.
Oil Is Adding Another Layer of Risk
Oil prices are also moving higher again as tensions in the Middle East continue.
That creates two problems for stocks.
First, higher energy prices can squeeze consumers and corporate margins. Second, they can keep inflation elevated at exactly the time markets are trying to determine whether the Fed can eventually become less restrictive.
A resolution to the conflict could quickly remove some of that pressure. But after months without a meaningful breakthrough, there is no guarantee that September will suddenly bring one.
Until it does, oil remains another potential source of pressure on equities.
The U.S. Data Still Needs to Improve
The economic backdrop isn't helping much either.
Recent Non-Farm Payrolls and retail sales data have shown clear signs of deterioration. One stronger report won't necessarily erase those concerns.
What the market really needs is several months of improving data showing that economic momentum is stabilizing without reigniting inflation.
That creates a difficult setup.
Stronger data could help ease recession concerns, but it could also push Treasury yields higher by reinforcing the Fed's hawkish stance.
Weaker data could pull yields lower, but it would also deepen concerns about economic growth.
Either way, September could remain a difficult environment for equities.
Technicals Are Starting to Line UpWith the Seasonal Story
This isn't just a macro argument.
The Nasdaq has started showing signs of deterioration, with lower highs and lower lows suggesting that momentum may be rolling over.
That's what makes this year's September seasonality more interesting.
Seasonality by itself is not enough to short the market. But when you combine:
historically weak September returns + elevated Treasury yields + rising oil prices + softer economic data + weakening technical structure, the bearish case becomes harder to dismiss.
For prop traders, that doesn't mean blindly selling NQ or ES.
It means being more cautious about aggressively buying dips and paying closer attention to failed rallies, lower highs and breakdown setups.
Gold Tells a Very Different Seasonal Story
This is where the picture gets especially interesting.
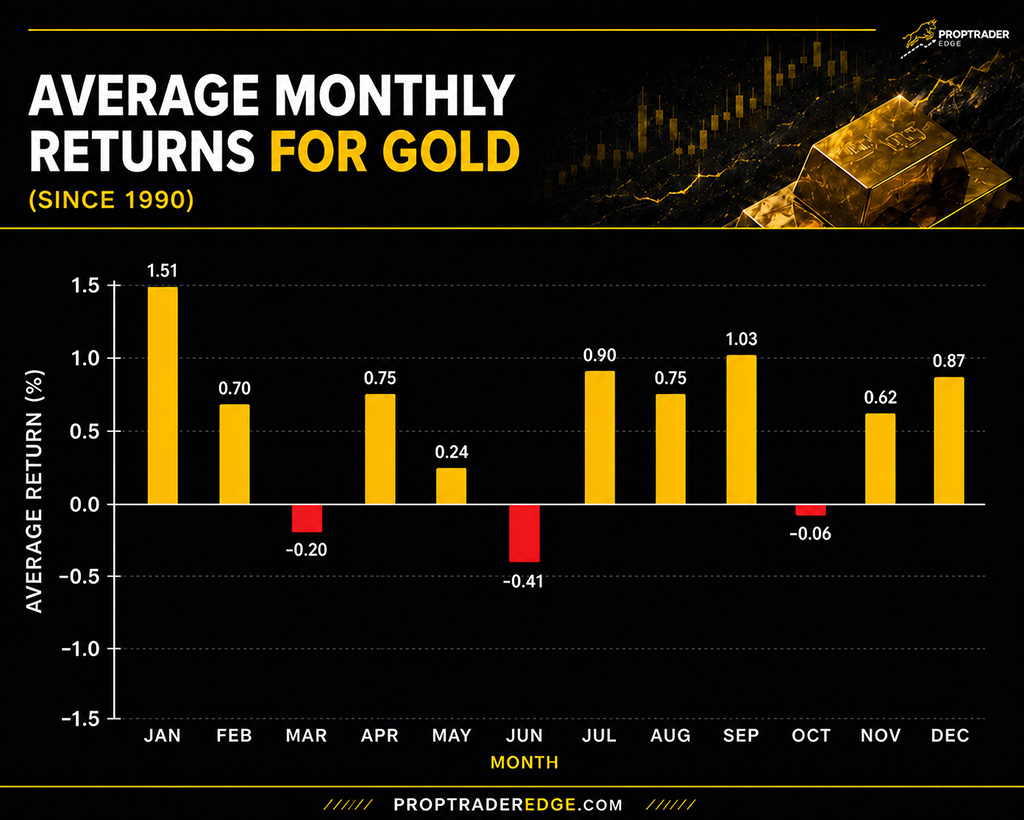
Unlike stocks, September has historically been a strong month for gold.
Using data going back to 1990, gold has averaged a +1.03% return in September, making it one of the better months of the year.
The average monthly returns in the data show:
Only March, June and October have produced negative average returns in the dataset.
That's a major change from the shorter-term seasonal picture traders sometimes focus on. Recent Septembers haven't always been kind to gold, but the longer-term historical data paints a much more constructive picture.
And the current market environment could support it.
If equity volatility increases, economic concerns worsen or investors look for defensive assets, gold could attract additional demand.
The biggest risk is the bond market.
If stronger U.S. data drives Treasury yields and the U.S. dollar sharply higher, gold could come under pressure despite its positive seasonal tendency.
What About the U.S. Dollar?
The dollar is another piece of the puzzle.
Elevated Treasury yields and a more hawkish Federal Reserve are currently giving the greenback support. If upcoming U.S. economic data improves, that could reinforce the move by reducing expectations for easier monetary policy.
That would create a potentially interesting combination:
Stocks under pressure, Treasury yields elevated and the dollar strengthening.
For FX traders, that means watching dollar pairs closely rather than assuming recent dollar weakness will automatically continue.
September 2026 Trading Cheat Sheet
✅ Prop Trader Edge Tip: Don't trade seasonality by itself. Use it as a directional filter. If September's historical tendencies start lining up with price action, macro conditions and your technical setup, that's when the information becomes useful.