




There are hundreds of candlestick patterns traders can study. Dojis, hammers, morning stars, haramis and engulfing candles all claim to reveal what buyers and sellers may do next.
But which candlestick pattern is actually the best?
Most patterns are taught using carefully selected charts that make the signal look obvious after the move has already happened. A pattern may appear convincing visually, but that does not mean it produces consistent results across thousands of trades.
Two major data-driven studies attempted to answer this question. Both pointed to the same pattern: BearishEngulfing.
Quantified Strategies ranked bearish engulfing first among 75 candlestick patterns tested on the S&P 500. Thomas Bulkowski also found it to be the best-performing bearish reversal pattern after studying more than 4.7 million price bars.
What makes the findings especially interesting is that the two studies discovered different ways to use it.
What Is a Bearish Engulfing Pattern?
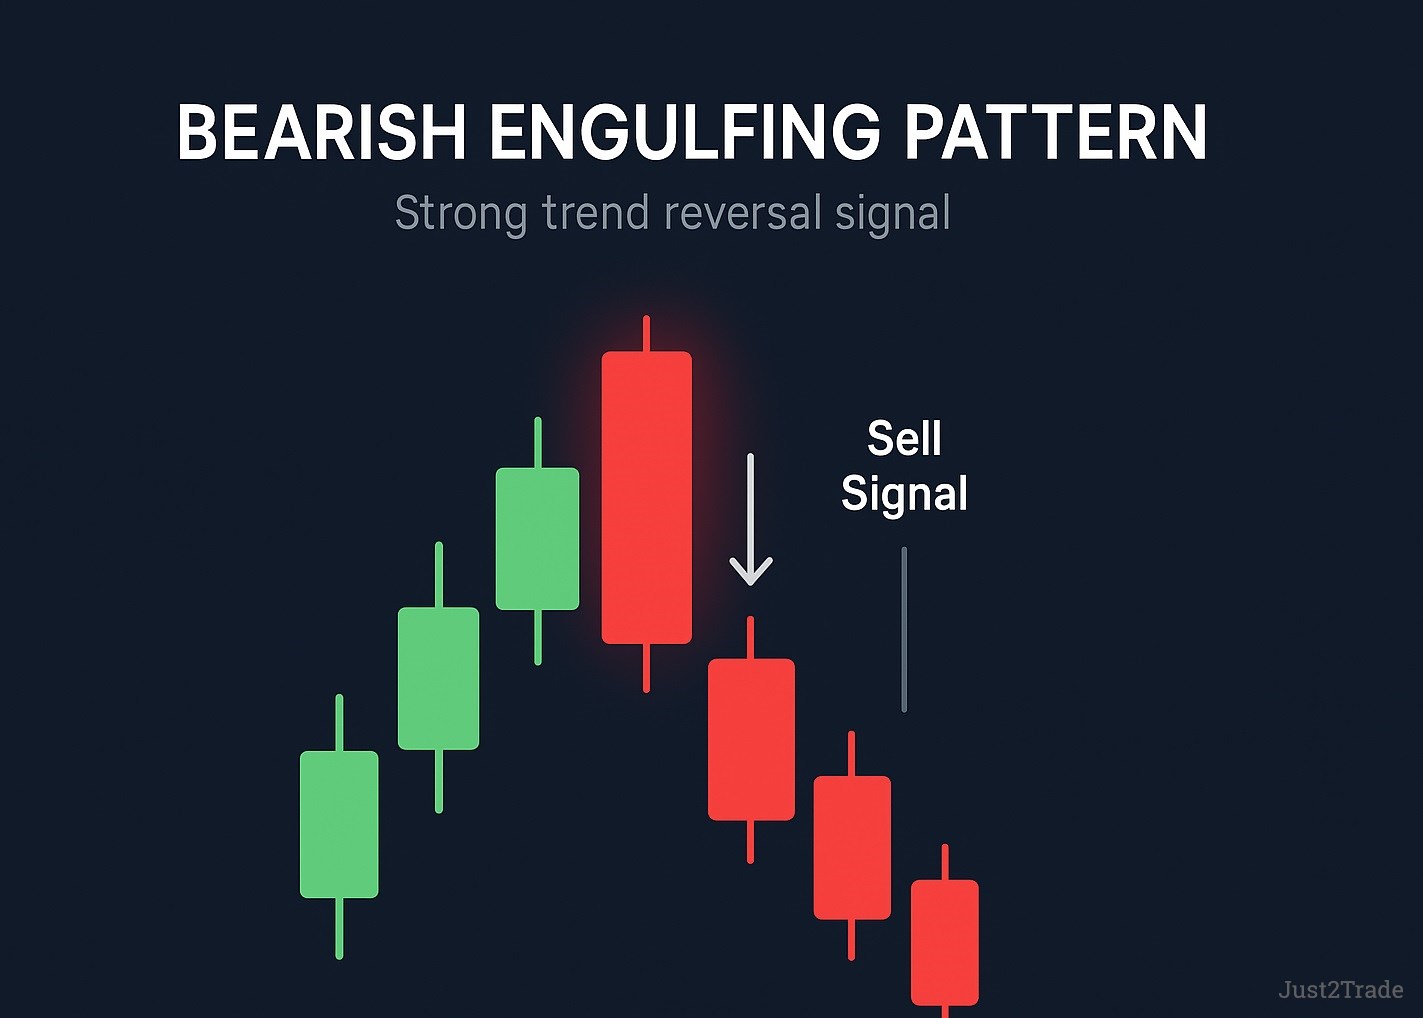
A bearish engulfing pattern is a two-candle formation that usually appears after price has been rising.
The first candle is bullish. The second candle opens higher but reverses sharply and closes below the opening price of the previous candle.
The body of the second bearish candle completely engulfs the body of the first bullish candle. The shadows, or wicks, do not need to be engulfed.
Visually, the pattern captures a dramatic shift in control. Buyers initially appear to have momentum, but sellers step in, erase the previous candle’s gains and close price decisively lower.
That makes bearish engulfing easy to identify, but appearance alone is not enough. Its location, confirmation and broader market environment determine whether the pattern becomes a tradable signal.
Encyclopedia of Candlestick Charts
Encyclopedia of Candlestick Charts, written by Thomas Bulkowski, is a comprehensive, data-driven reference for traders who want to understand candlestick patterns beyond visual intuition and traditional folklore.
Bulkowski analyzed more than 4.7 million price bars, identifying and tracking 103 candlestick patterns across 500 stocks over 10 years.
He removed the rarest patterns and ranked the remaining formations using three primary factors:
The goal was not simply to find a pattern that predicted direction. It also needed to appear often enough to trade and produce a move large enough to matter.
Bearish engulfing finished first among bearish reversal patterns.
When the formation appeared during an uptrend and price subsequently closed below the bottom of the two-candle pattern, it acted as a bearish reversal 79% of the time.
Ten days after the formation, the average decline was:
Bulkowski did not treat the engulfing candle itself as an automatic short entry. A downward breakout was confirmed only after price closed below the low of the complete pattern. The bearish engulfing candle created the setup, while the break below its low confirmed that sellers remained in control.
Why Bearish Engulfing Beats Bullish Engulfing
Bearish and bullish engulfing patterns are mirror images, but their historical results are not equal.
In Bulkowski’s testing, bearish engulfing produced a bearish reversal 79% of the time. Bullish engulfing produced a bullish reversal only 63% of the time. Bearish engulfing ranked fifth for reversal accuracy among 103 patterns, while bullish engulfing ranked 22nd.
One explanation is that bear markets can produce stronger continuation.
Downside moves are often accelerated by stop-loss orders, forced liquidation, margin pressure and traders rushing to reduce exposure. Once important support breaks, that additional selling can help price continue lower more aggressively.
Bullish reversals do not always benefit from the same urgency. A bullish engulfing candle may generate a temporary rebound, but if the broader trend remains bearish, sellers can quickly return.
Bulkowski’s numbers illustrate this difference. The average decline following a confirmed bearish engulfing pattern increased from 3.56% in a bull market to 5.92% in a bear market. The pattern became more powerful when the broader environment already supported downside continuation.
However, this does not mean every bearish engulfing candle begins a lasting downtrend. Bulkowski also found that the post-breakout move was often short-lived. The pattern can identify an initial reversal correctly without guaranteeing a sustained collapse.
The Quantified StrategiesBacktest
Quantified Strategies tested 75 candlestick patterns using mechanical rules on the S&P 500.
Bearish engulfing ranked number one overall. Its win rate increased from approximately 55.31% after one trading day to more than 70% by day 17.
But there was a surprising difference.
Quantified Strategies tested the pattern as a buy signal, not a traditional short setup. In this backtest, the sharp bearish candle created a bullish mean-reversion opportunity.
This can happen because broad stock indices have historically maintained a long-term upward bias. A dramatic bearish engulfing candle may represent short-term fear, liquidation or temporary exhaustion rather than the beginning of a lasting bear trend.
In other words, Bulkowski tested bearish engulfing as a confirmed downside reversal after an uptrend. Quantified Strategies tested whether the S&P 500 tended to recover after the pattern appeared.
The different outcomes show why traders should never judge a candlestick solely by its name.
How Prop Traders Can Use Bearish Engulfing
For a bearish reversal setup, look for the pattern after a clear upward move, preferably near resistance, a previous high or another important technical level.
Instead of shorting immediately, wait for price to close below the pattern’s low. The high of the engulfing candle can provide a logical invalidation level.
For a bullish mean-reversion setup in an equity index, the same candle may signal that short-term selling has become stretched. That approach is more appropriate when the broader market trend remains bullish and price is approaching support.
The most important lesson is that bearish engulfing is a setup, not a complete trading strategy.
It earned the number-one ranking in two major studies, but context determined how it performed. The potential edge comes from combining the pattern with market direction, location, confirmation, risk management and clearly defined exit rules.
Sources: Quantified Strategies, 10 Best Candlestick Patterns Ranked by Performance; Thomas N. Bulkowski, Encyclopedia of Candlestick Charts and The Eight Best-Performing Candles.