





Bitcoin’s move back above $86,000 has grabbed plenty of attention, especially after nearly $900 million in leveraged crypto positions were liquidated over 24 hours. Bitcoin is now roughly 50% above its lows from just two months ago, but from a technical perspective, the more important development may be happening on the weekly chart.
For the first time in 45 weeks, Bitcoin has closed above its 50-week simple moving average, or 50-week SMA. This is one of the most closely watched long-term trend indicators in Bitcoin because, historically, it has often helped traders distinguish between a bear market, a recovery, and the beginning of a more sustained bullish trend.
What Is the 50-Week SMA?
A simple moving average takes a set number of closing prices, adds them together and divides by the number of periods. In the case of the 50-week SMA, it uses the last 50 weekly closing prices, which gives traders a rough one-year average price for Bitcoin.
The important part is the timeframe.
Shorter moving averages such as the 20-day or 50-day SMA respond quickly to changes in price. That makes them useful for shorter-term trading, but they can also generate a lot of noise. Bitcoin can move above and below those averages frequently without meaningfully changing its longer-term trend.
The 50-week SMA moves much more slowly. Because each candle represents an entire week, it filters out much of that short-term volatility and gives traders a broader view of whether Bitcoin is generally trending higher or lower.
That is why a weekly close above or below the 50-week SMA carries more weight than a brief intraday move through it.
Why the Bitcoin 50-Week SMA Reclaim Matters
Bitcoin has historically shown a tendency to respect the 50-week SMA during major market cycles.
During bear markets, Bitcoin often falls below the moving average and then struggles to reclaim it. Rallies may push back toward the 50-week SMA, but if sellers repeatedly step in near the level, the moving average begins acting as resistance.
That tells traders something important. Even though Bitcoin may be bouncing, the longer-term trend has not necessarily changed.
A sustained break back above the 50-week SMA can signal a different market environment. Instead of every rally being sold, buyers may be gaining enough control to push Bitcoin back above its longer-term average price.
This is why the 50-week SMA is better viewed as a market regime indicator than as a simple buy or sell signal. It helps traders understand whether the broader market is behaving more like a bull market or a bear market.
Historical data reinforces that idea. Galaxy Research looked at Bitcoin bear markets going back to 2011 and found 13 weekly crossings back above the 50-week moving average. In 11 of those 13 cases, Bitcoin did not go on to make a new cycle low.
That does not mean every reclaim leads to a huge rally, but historically, getting back above the 50-week SMA has often been an important step in the transition out of a bear market.
What Previous Bitcoin Cycles Tell Us
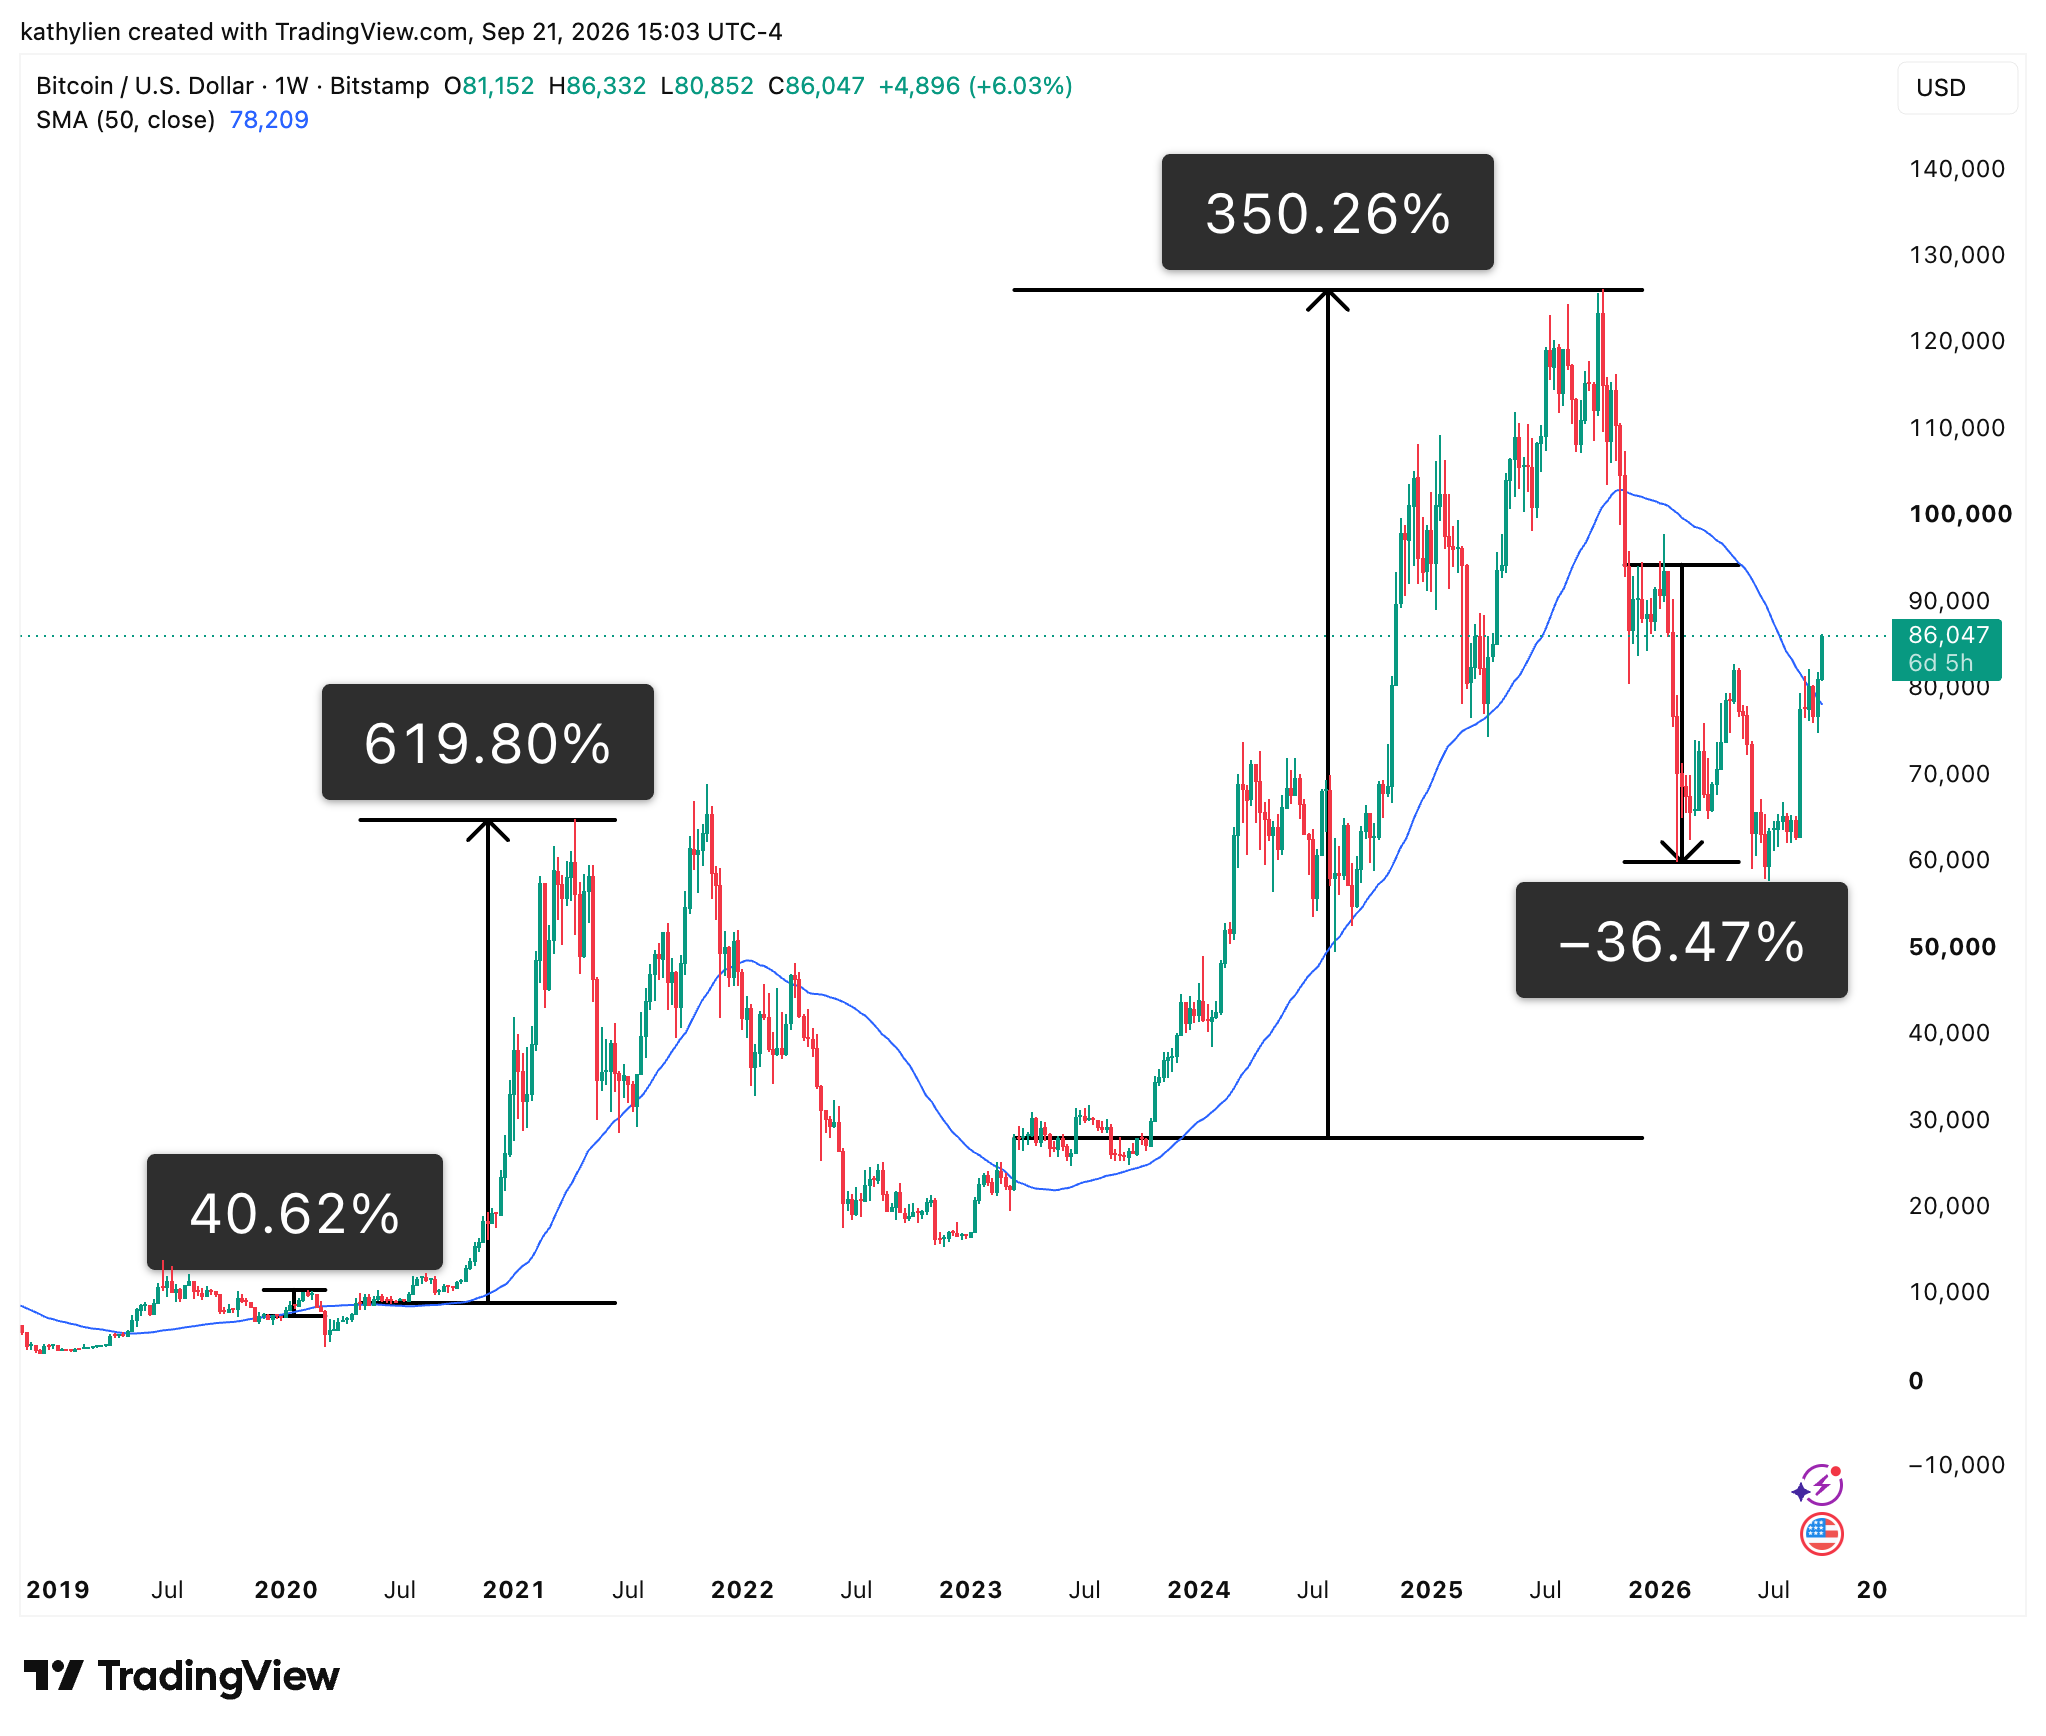
The last major move below the 50-week SMA came in November 2025. After Bitcoin lost the level, it went on to decline roughly 36% before eventually bottoming this summer.
That is a good example of why traders watch the average on the downside. Once Bitcoin fell below it, the longer-term trend weakened and the moving average became an important dividing line.
Historical upside reclaims have been equally notable.
In March 2023, Bitcoin moved back above the 50-week SMA at around $28,000. Bitcoin ultimately climbed to roughly $126,000 by October 2025.
After the COVID crash, Bitcoin reclaimed the 50-week SMA around $9,000 in May 2020. Less than a year later, Bitcoin was trading near $64,000.
A similar pattern appeared in 2019. After the 2018 bear market, Bitcoin reclaimed the 50-week SMA around $5,800 in May 2019. The initial rally quickly exceeded 40%, and Bitcoin eventually approached $14,000 just over a month later.
The important lesson is not that crossing the 50-week SMA automatically produces those gains. Moving averages do not cause markets to rally.
Instead, the reclaim tends to happen when the underlying trend is already improving. The moving average helps traders identify that shift.
Why the Signal Can Fail
No technical indicator works all the time, and the 50-week SMA is no exception.
During the 2021-2022 bear market, Bitcoin moved back above the 50-week SMA in December 2021 and again in March 2022. Both breakouts failed, and Bitcoin eventually fell toward $16,000.
These false breakouts are an important reminder that traders should not treat one moving-average cross as confirmation by itself.
A stronger signal typically comes when Bitcoin closes above the average, remains above it and then successfully uses the level as support on a pullback.
That combination tells traders much more than a single candle.
What Traders Should Watch Now
Bitcoin closed last week around $81,159, while the 50-week SMA was near $78,788. Price has since pushed above $86,000, giving Bitcoin some distance above the average.
The next important test will be whether Bitcoin can stay there.
If the 50-week SMA begins acting as support on future pullbacks, it would suggest the longer-term market structure is continuing to improve. If Bitcoin quickly falls back below the average and begins closing beneath it again, the breakout becomes less convincing.
This is ultimately why the 50-week SMA matters. It is not designed to predict tomorrow’s price or tell traders exactly where Bitcoin will go next. Its value is in helping identify the bigger trend.
In November 2025, Bitcoin broke below the 50-week SMA and a 36% decline followed. In September 2026, Bitcoin has finally moved back above that same level.
For traders trying to understand whether Bitcoin is simply experiencing another sharp rally or entering a more meaningful bull-market phase, the 50-week SMA is one of the most important levels on the chart to watch.