




The October stock market scares people, and it is easy to understand why. This is the month associated with some of the most infamous market crashes in history, including the Panic of 1907, Black Thursday and Black Tuesday in 1929, and Black Monday in 1987, when the Dow dropped 22.6% in a single day. It is still the worst session in its history.
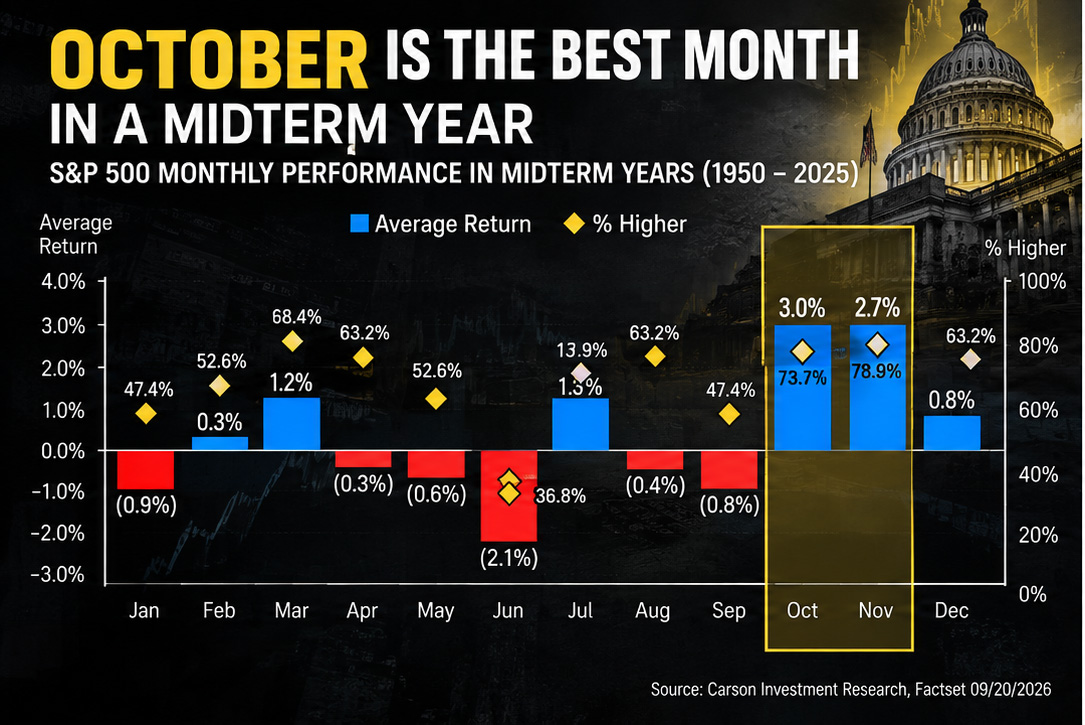
But what gets lost in the headlines is that October is not actually a bad month for stocks, especially during midterm election years. According to Carson Investment Research, going back to 1950, October has delivered an average return of 3.0% in midterm years and has finished higher 73.7% of the time. November has been almost as strong, averaging 2.7% with a 78.9% win rate.
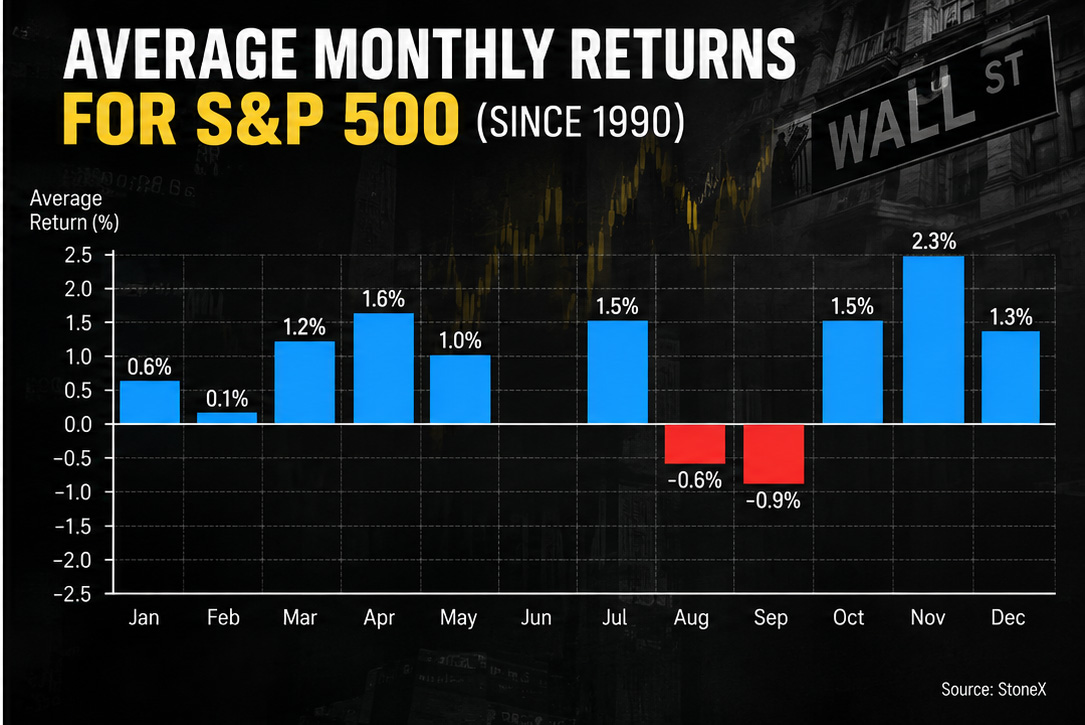
That October stock market pattern is roughly a 3-in-4 historical win rate for two consecutive months right in the heart of Q4. So the more interesting question is not why October is feared, but why its reputation is so much worse than its actual performance.
October Stock Market: Volatility Is Not the Same as a Down Month
There is a big difference between volatility and performance, and traders often confuse the two. October has a history of producing very large selloffs, but that does not mean the month itself usually ends lower.
You can have one or two brutal sessions inside a month that ultimately closes green. That is exactly why October often feels much worse than it actually performs. Investors remember the crash far more vividly than the recovery that follows.
In midterm years, the contrast is especially striking. September has historically fallen 0.8% on average and has finished higher just 47.4% of the time, while June has averaged a decline of 2.1%. That weakness often sets the stage for a much stronger fourth quarter.
Why October Stock Market History Looks Different in Midterm Years
Markets hate uncertainty, and elections create plenty of it. Investors spend months trying to figure out what changes in Washington could mean for taxes, regulation, spending, and the broader economy.
Once the election is over, one major layer of uncertainty starts to disappear. That may be one reason the market has historically performed so well around this part of the cycle.
Research cited by Fidelity shows that the year following a midterm election has averaged about 14.5% for the S&P 500, with the market finishing higher roughly 95% of the time. One common explanation is that the president’s party often loses seats, which can lead to more political gridlock and fewer major policy surprises. You can debate the reason, but the pattern itself has been remarkably consistent.
But 2026 Is Not a Normal Midterm Year
There are several reasons this year could behave differently.
First, the market already entered Q4 with strong gains behind it. That raises the obvious question of how much of the normal post-election optimism may already be priced in.
Second, AI has changed the market backdrop. The boom in data centers, chips, and computing infrastructure has supported many of the market’s biggest names and kept investors chasing growth even as interest rates moved higher.
Third, earnings season arrives right in the middle of October. Alphabet, Amazon, and Microsoft are all due to report in the second half of the month, and investors will be watching closely to see whether all of that AI spending is translating into revenue, how quickly capital expenditures are rising, and whether management teams remain confident about demand.
When expectations are this high, even very good results can disappoint. That combination of strong seasonality, major earnings, and elevated valuations could make October especially volatile.
A 70% Win Rate Is a Tailwind,Not a Signal
A 73.7% win rate is impressive, but it still means the market fell in roughly one out of every four midterm Octobers. November’s 78.9% win rate is even stronger, but it is still not a guarantee.
Seasonality should be treated as context, not as a reason to blindly buy stocks. It becomes much more useful when the rest of the picture lines up, including strong earnings, supportive economic data, stable yields, and key technical levels holding.
If those conditions start to break down, the calendar alone is not enough.
The Real Risk: 5.3%
The biggest challenge to the bullish seasonal setup is the bond market. Treasury yields around 5.3% create a very different environment from many prior midterm years.
Higher yields matter for two main reasons. First, they increase the discount rate investors use to value future earnings, which tends to hit growth and technology stocks the hardest because so much of their valuation depends on profits expected years into the future.
Second, Treasuries above 5% give investors a much more attractive alternative to stocks. When government bonds are offering that kind of return, investors do not have to take nearly as much equity risk to generate income.
That creates a real tug of war for Q4. On one side, October and November have historically been two of the strongest months of the midterm cycle. On the other, valuations are elevated, AI expectations are high, and Treasury yields are sitting at levels that can pressure equity multiples.
Your Takeaway
October deserves respect, but not fear. Its history is really about volatility, not consistently poor returns.
In midterm years, October has been the strongest month of the year, averaging 3.0% with a 73.7% win rate. November is right behind it, averaging 2.7% with a 78.9% win rate.
The problem is that this year, one number may matter more than all of those seasonal statistics: 5.3%.
If Treasury yields stabilize or start to fall, the historical October-November tailwind has room to work. If yields continue climbing, the bond market could overpower even one of the strongest seasonal periods on the calendar.
So the real question for Q4 is not simply whether history repeats. It is whether 70% seasonality can beat 5.3% yields.